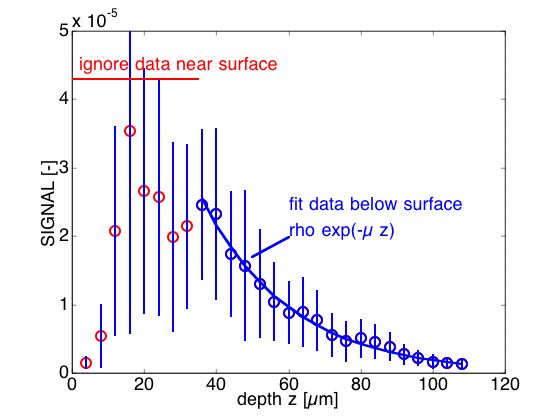
After an image cube was acquired, a sampling of the full data cube was analyzed. 10 random positions were chosen. For each position, the mean value of 49 pixels in a 7x7 x,y neighborhood was determined for each depth. The fit of this mean signal versus depth zf yielded values for ρ and μ for the expression SIGNAL = exp(-μ zf). Then the mean values for each of the 10 random positions were analyzed to yield a net mean and standard deviation (n = 10 position) that characterized the tissue, which are shown in the results on the following pages.
On this page, a typical example of the experimental SIGNAL(zf) = MEASUREMENT/Po at one x,y position is shown below. The figure shows the mean ± standard deviation of confocal SIGNAL (in calibrated reflectance units) for a neighborhood of pixels (n = 49) at one randomly chosen x,y position on muscle tissue. NOTE: Calibration based on signal from water/glass interface was 100% reflectivity = 5.29x10⁴ [Volts].
(Click on figure to expand)
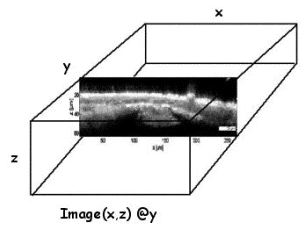
Figure shows an x,z slice at y, but the original data is an x,y,z cube of data.