Paul Campagnola et al., University of Connecticut Health Center, USA
Saratov Internet Conference, Sep. 26, 2006.
|
Steven Jacques, Ravikant Samatham, Oregon Health & Science University (OHSU), USA Paul Campagnola et al., University of Connecticut Health Center, USA |

| 
| 
|
| Steve | Ravi | Paul |
ABSTRACT Separation of the two optical scattering properties, the scattering coefficient (µs) and the anisotropy of scattering (g), has been experimentally difficult in tissues. A new method for measuring these properties in tissues uses reflectance-mode confocal scanning laser microscopy (rCSLM). The method was applied to 3 mouse tissues, one wild type (wt/wt), one heterozygous mutant (mut/wt), and one homozygous mutant (mut/mut), where the mutation is for osteogenesis imperfecta, a bone disease that affects collagen I structure. The mutation also affected the collagen fibrils of the skin. The measurements showed that the average scattering coefficient (µs) decreased with the presence of the mutant allele, varying as mut/mut < mut/wt < wt/wt. The anisotropy of scattering (g) also decreased with added mutant allele, varying as mut/mut < mut/wt < wt/wt. Such behavior may suggest that the tropocollagen molecules are failing to organize into fibrils with the 70-nm periodicity that is putatively responsible for the Rayleigh scattering that dominates blue light reflectivity. Without the periodicity of refractive index fluctuation, the fibril structure becomes more optically homogeneous and scattering decreases. The decrease in g (toward more isotropic scattering) could be due to the failure of the mutant fibrils to assemble into the larger 2-3 µm-dia. collagen fiber bundles that yield forward scattering (Mie scattering).
INTRODUCTION Can optical methods discriminate the changes induced in collagen fibrils of a skin site? Paul Campagnola et al. believe so, and are measuring the optical properties of mouse skin samples with disease-altered collagen fibril size. Paul sent us 3 skin samples, and we tried to discriminate the samples using our reflectance-mode confocal scanning laser microscope (rCSLM). Our rCSLM can discriminate the scattering coefficient, µs, and the anisotropy of scattering, g, in contrast to other optical measurements of light transport which depend on lumped parameter called the reduced scattering coefficient, µs' = µs(1-g). A preliminary web report on this method is posted.
METHOD The rCSLM used a 488-nm argon ion laser (blue light) (Fig. 2). A z-axis stage moved the sample relative to the focus of the microscope, and an x-y image was acquired at each depth in the tissue. The result was a 3D image, R(x,y,z), which was calibrated against the reflectance from an oil-glass interface, such that R = 1 for a mirror. Analysis involved fitting the exponential decay of R(z) at several x,y positions, using the expression
R(z) = ρ exp(–µz)
The experimental values of ρ [dimensionless] and µ [cm–1] were determined for a region between 25-45 µm below the skin surface, which avoided the complexity of the epidermal region and assessed the status of the dermal layer, but avoided becoming too deep where multiple scattering starts to dominate and confuse the signal.
TISSUES Three mouse skin samples were sent to OHSU by Paul Campagnola, Univ. of Connecticut Health Center (Fig. 1), blindly labeled as samples #1, #2 and #3, which later were identified to be:
#1 = mut/mut
#2 = wt/wt
3# = mut/wt
Three 3D images, R(x,y,z) were acquired for each sample (Fig. 3). The axial scan versus depth R(z) for 25 sites on each image (averaging x,y pixels within a 10um x 10um region at each depth of the scan) was determined (Fig. 4). During imaging, the lens was coupled to the tissue by the solution in which each sample was sent, labeled as "water" in Fig. 2B.
RESULTS The ρ and µ were quite variable for the 25 positions on the 3 sites for each of the 3 samples (Fig. 5). This variation may be partially due to hair follicles and other heterogeneties in skin structure which were not considered when the computer randomly sampled the 3D R(x,y,z) image to specify values of ρ and µ. But there is a trend that seems to order the sample is agreement with their genotype.
The data in Fig. 5B best illustrate the trend in optical properties versus added mutant allele because they separate the sites versus a grid of the two properties µs and g. Figure 5B suggests that µs decreases and g decreases with added mutant allele.
Figure 6A shows histograms of the µ and ρ. experimental data. The results do not offer a clear indication of how the mutation influences the µ and ρ data.
Figure 6B shows histograms of the µs and g optical properties deduced by using the analysis grid. The results indicate that the average value of the scattering coefficient (µs) of the mut/mut sample #1 was lower than that of the wt/wt sample #2. Similarly, the anisotropy (g) of the mut/mut was lower than that of the wt/wt. The heterozygous mut/wt behaved more like the wt/wt than the mut/mut, however, there were some sites that shows decreased µs and g values.
Note: this is a preliminary analysis.
The ρ needs more work to account for the attenuation by the superficial tissue layers. This correction will have a big impact on the ρ. The µ should have been a more reliable measurement, but the variation was quite high. More careful analysis will remove bad sites where superficial irregularities such as hair follicles and disruptions of the regular epidermal architecture may have affected the fitting for ρ and µ.
CONCLUSION The addition of mutant allele appears to decrease the scattering coefficient and decrease the anisotropy of scattering. This conclusion remains tentative until further analysis addresses the issue of hair follicles and epidermal heterogeneities that interfered with the automated fitting of R(z) data.
In general, at the blue wavelength (488 nm) of these expeiments, Rayleigh scattering (due to the 70-nm peridocity as 3 tropocollagen molecules align into fibrils) dominates over Mie scattering (due to scattering from the large 2-3 µm-dia. collagen fiber bundles assembled from fibrils). The effect of the mutation to lower µs and lower g may be consistent with abnormal fibrils that fail to generate Rayleigh scattering, but also fail to aggregate into large collagen fiber bundles to elicit Mie scattering.
This work is in progress. However, this report illustrates how rCSLM measurements can specify the optical properties µs and g and provide a glimpse into how genotype can influence structure at the molecular and ultrastructural level.
Fig. 1
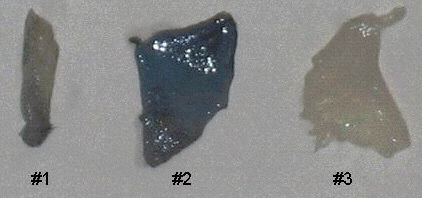
Fig. 1: Three skin samples.
#1 = mut/mut. #2 = wt/wt. #3 = mut/wt.
Fig. 2A
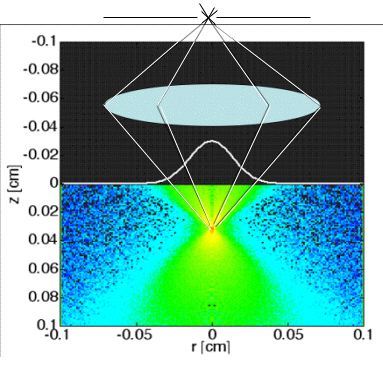
Fig. 2A: In reflectance-mode confocal scanning laser microscopy (rCSLM), the light reflected from the focus of a lens within a tissue is passed through a pinhole to reach the detector. This confocal arrangement rejects multiply scattered photons, allowing measurement of the localized backscatter from superficial tissues. The focus is scanned down into the tissue to yield a depth profile R(z) at each position x,y. Lateral x,y scanning is accomplished by galvo mirrors (not shown). The reflectance from the focus falls exponentially versus depth of focus (z):
R(z) = ρ exp(-µz)
thereby specifying two experimental parameters, an attenuation constant µ and a reflectivity ρ.
Fig. 2B
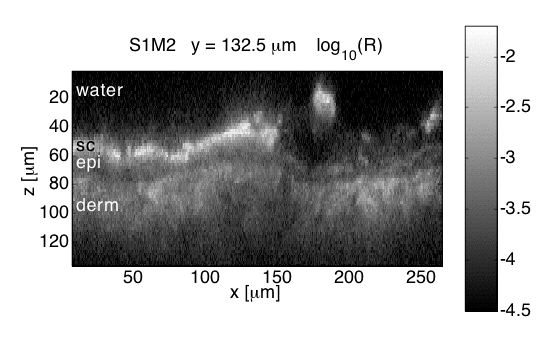
Fig. 2B: Confocal image of skin shows stratum corneum, epidermis, and dermis
Occasional hair follicles occur.
Fig. 3, Sample #1: mut/mut
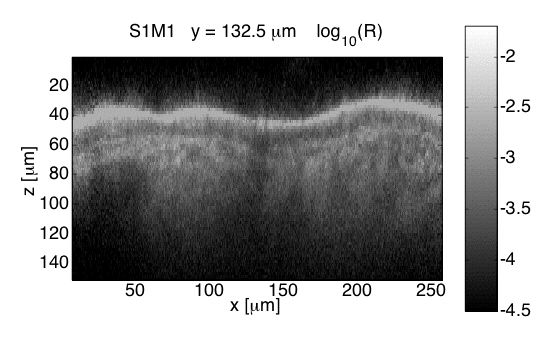

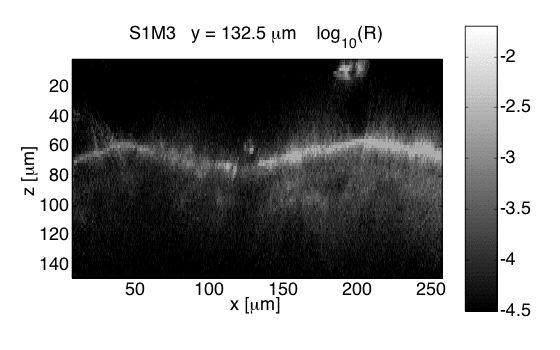
Fig. 3, Sample #2: wt/wt
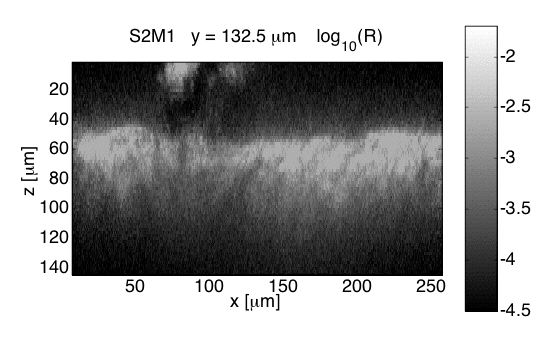
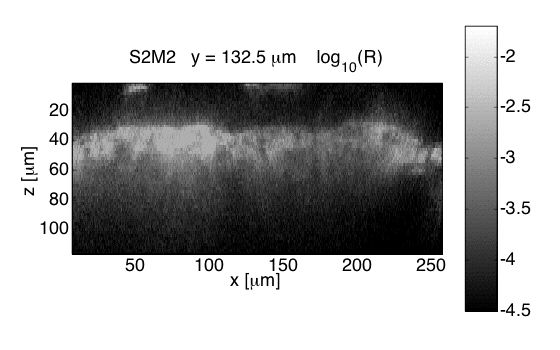
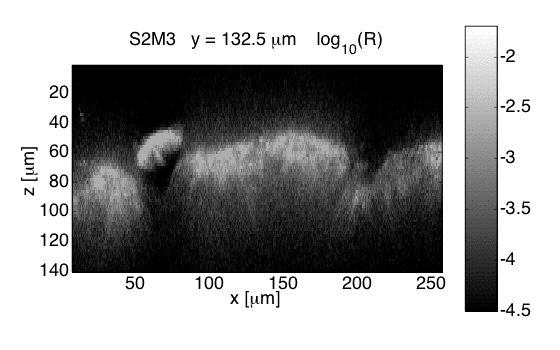
Fig. 3, Sample #3: mut/wt
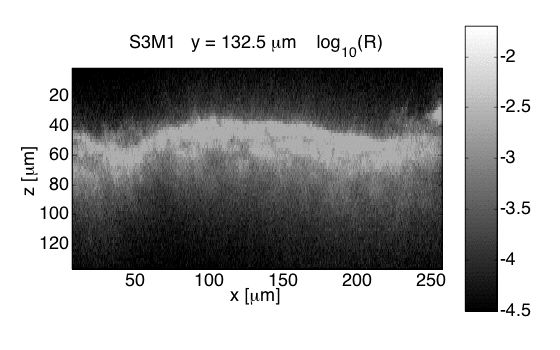

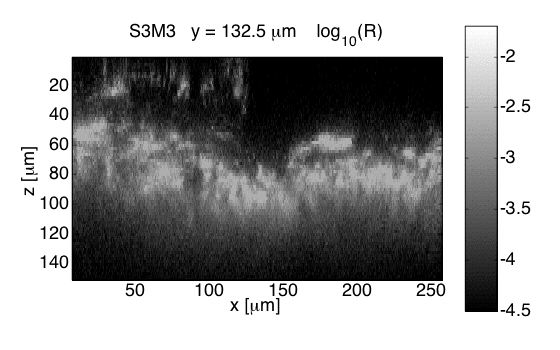
Fig. 3: Three sites on each of 3 skin samples. The color bar encoded the log10(R), where R is reflectance. At the top is water contacting the stratum corneum. In some sites, the epidermis is clearly visible. Then a burst of dermal scattering occurs. Finally, at the deeper depths the signal becomes affected by multiple scattering, and at the deepest depths the signal approaches the noise floor due to multiply scattered light.
Fig. 4, Sample #1: mut/mut
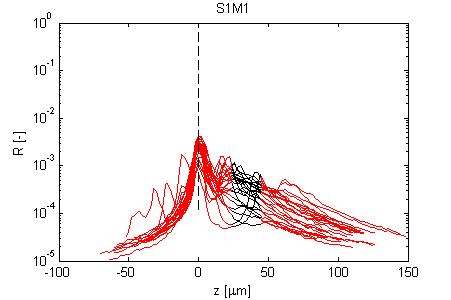
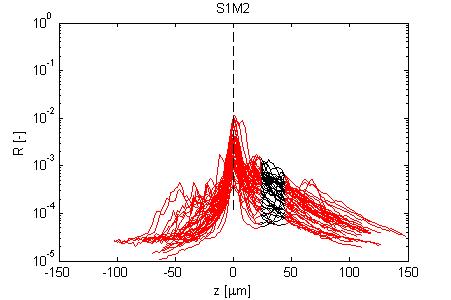
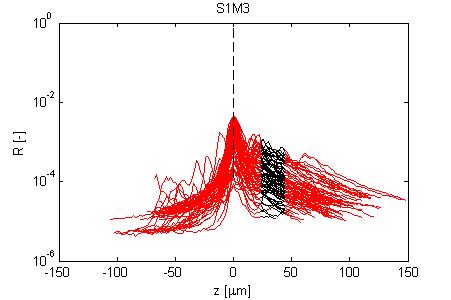
Fig. 4, Sample #2: wt/wt

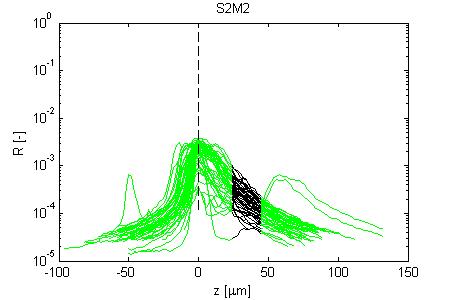
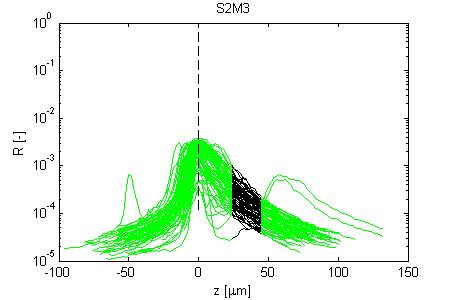
Fig. 4, Sample #3: mut/wt
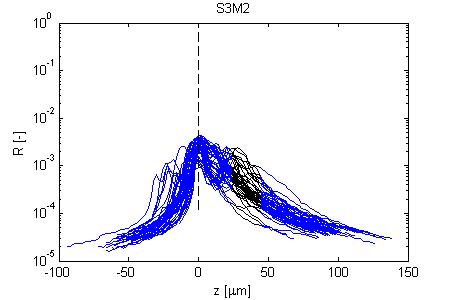


Fig. 4: Three sets of R(z) traces for 25 x,y positions on each of 3 skin samples. The semilog plot shows depth z on x-axis and reflectance (R) on log(y)-axis. The black region shows where the fitting for ρ and µ occurred. After an initial strong reflectance from the water/stratum corneum interface, and a drop in R in the epidermis, the dermal signal falls exponentially (black line), then slows a little as multiple scattering begins to contribute. Finally at the deepest depth, the signal drops toward the noise floor of the system. NOTE: Scans versus z for analysis from a grid of x,y positions were automated, and no attempt has yet been made to eliminate bad sites where a superficial structural irregularity occured (eg., hair follicle or epidermal heterogeneity), hence some of the scans yield a poor fit and poor ρ,µ data.
Fig. 5
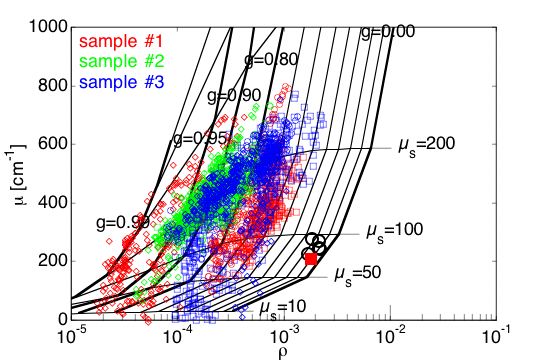 #1 = mut/mut, #2 = wt/wt, #3 = mut/wt
Fig. 5A: The map of µ versus ρ on a semilogx plot. The grid shows iso-µs contours (scattering coefficient) and iso-g contours (anisotropy). Samples #2 and #3 have higher µ values and lower g values than sample #1. Tissues appeared to have scattering µs = 100-200 cm–1 and anisotropy g = 0.6-0.95. The black circles show the calibration measurements on 0.1-µm-dia. polystyrene microspheres, which compare well with the prediction of Mie theory (red square).
 #1 = mut/mut, #2 = wt/wt, #3 = mut/wt
Fig. 5B: The data for each of the 3 samples is plotted separately. Samples 2 and 3 fall on the µs = 200 cm–1 contour, and anisotropy is in the g=0.7-0.95 range. The mut/mut sample #1 has lower µs, 100-200 cm–1 and lower anisotropy in the g=0.6-0.8 range. The wt/wt sample #2 has higher µs and anistoropy. The heterozygoous mut/wt sample #3 is more like the wt/wt than the mut/wt, but there is a partial lowering of some µs and g values.
The grid is based on the expressions:
ρ = µsLfb(g)
µ = (µsa(g) + µa)2G
where
Fig. 6:
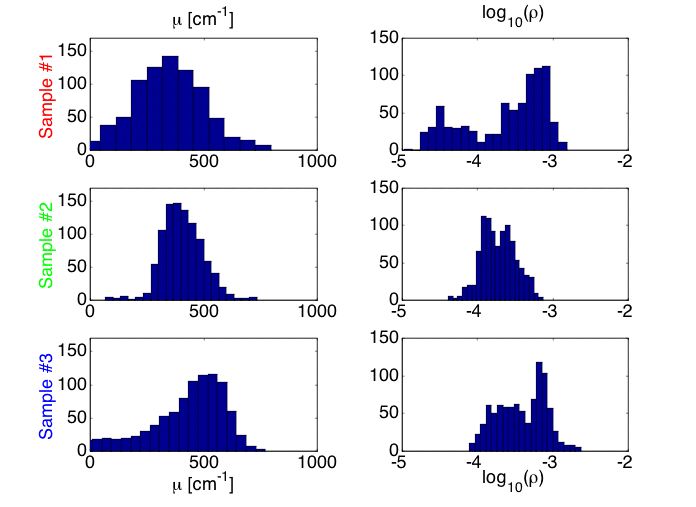
Fig. 6A: Histogram of µ and ρ values for samples #1 (mut/mut), #2 (wt/wt) and #3 (mut/wt).
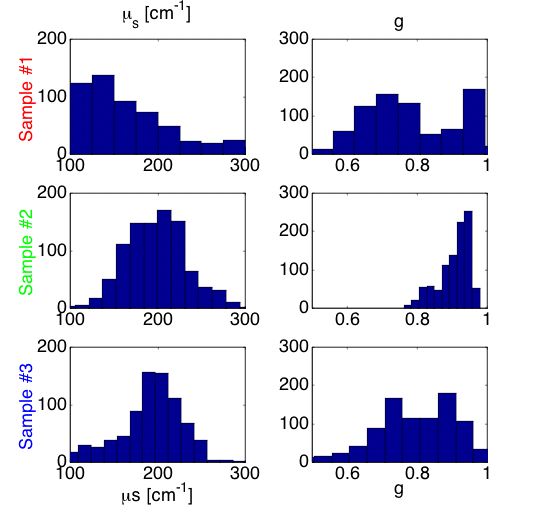
Fig. 6B: Histogram of µs and g values for samples #1 (mut/mut), #2 (wt/wt) and #3 (mut/wt).
Steven L. Jacques, Biomedical Engineering / Dermatology, Oregon Health & Science University. jacquess@ohsu.edu