The aorta is the large artery leaving the heart which first brings blood to the rest of the body. Because of its large size, it provides large sample sizes for convenient experimental measurements. Hence, it has been widely studied. It is not the same as other vessels, but perhaps is a reasonable first approximation.
This page contains graphs that summarize the optical properties of aorta, compiled from various reported studies. The tissues are either human, pig, or dog aorta, and the inter-species differences are not as important as the inter-study differences. In other words, variation in experimental technique and tissue preparation probably dominate the differences amongst data.
Two methods primary methods were used to generate data in this article: integrating sphere and photoacoustic.
- Integrating sphere measurements are a very common method. One measures transmission (T) through and reflectance (R) from the aorta. One deduces μa and μs' from R and T, based on a nonlinear relationship described by some theory (eg., diffusion theory, adding-doubling method, Monte Carlo).
- Photoacoustic measurements measure the pressure distribution created by the distribution of laser energy deposition by a Q-switched laser. A small temperature rise causes slight thermoelastic expansion which generates strong pressure waves that are detected by a piezoelectric transducer. One measures μa and μeff = sqrt(3 μa(μa + μs')), then calculates μs'.
Complete references and tabulated data.
The absorption coefficient μa [cm-1].
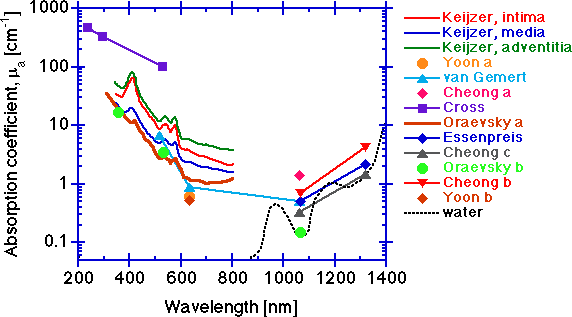
The absorption increases toward shorter wavelengths due to protein absorption, and toward longer wavelengths due to water absorption. In the 400-600 nm range, absorption by hemoglobin is very strong and residual hemoglobin staining of vessel walls is a strong influence. Hemoglobin contamination can be seen in some of the spectra in this region. In the central region between 600-1300, tissue absorption is lowest.
Integrating sphere measurements can yield artificially high μa values due to edge losses at the sphere's ports, and the data of Keijzer and Oraevsky a are suspect in this region. The low values of van Gemert, Yoon a and Yoon b at 633 nm, and the low values of van Gemert, Essenpreis, Cheong b and Cheong c at 1064 nm are probably good. The low value at 1064 from the photoacoustic measurements of Oraevsky b are as low as water itself. Since aorta tissue has only about 80% water content (rough estimate), the tissue is greater than 80% of the pure water μa value. Although the tissue measured in Oraevsky b is diseased aorta (atherosclerotic plaque), the optical properties are not very different from that of normal aorta (see the Oraevsky b paper for comparison). The data of Keijzer shows the individual optical properties of the three layers that comprise the aorta:
- intima (thickness = 286 ± 78 μm, n=3 samples)
- media (872 ± 225 μm)
- adventitia (175 ± 114 μm).
It should be pointed out that the inter-specimen variation in μa for three samples was as great as the inter-layer variation for μa. So while differences in optical properties of tissue layers are real, the inter-specimen variations can be significant. In general, one needs to assess the optical properties of any particular tissue site rather than rely on some average value from a library if accuracy is important. However, for general guidance of dosimetry in medical laser applications, the data of this graph and the following graphs are helpful.
The reduced scattering coefficient μs' [cm-1].
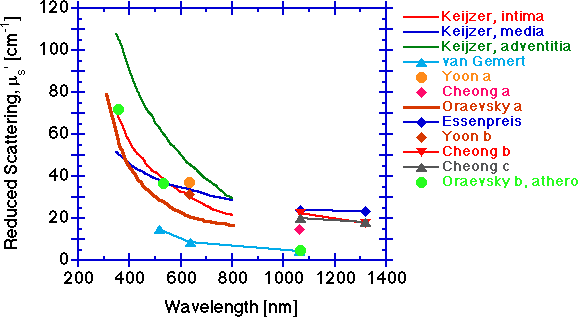
The scattering falls with increasing wavelength. The scattering behavior at shorter wavelengths below 600 nm is likely dominated by scattering from the periodicity and size of refractive index fluctuations of the collagen fibrils, in the size range of 70 nm to hundreds of nm. Longer wavelength behavior beyond 600 nm is increasingly dominated by scattering from the larger 2-3 μm diameter cylinders of collagen fibers composed of collagen fibrils. Other tissue components may also contribute to the overall scattering, but collagen fibers at the micro and macro scale probably dominate the scattering.
The scattering coefficient μs [cm-1].
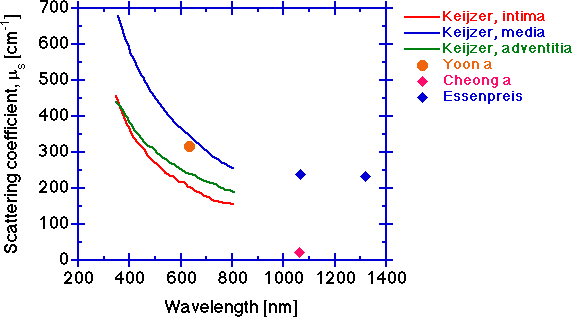
The scattering coefficient decreases with increasing wavelength for the same reasons given for the behavior of the reduced scattering coefficient. The measurement of μt is more tricky than one might think. Multiple scattering in a too thick sample can cause higher measured T and yield a lower μt. Too big a collection port such that some scattered light is still collected will also cause higher measured T and lower the calculated μt. An erroneously low μt will cause deduction of an erroneously low μs.
The anisotropy g [dimensionless].
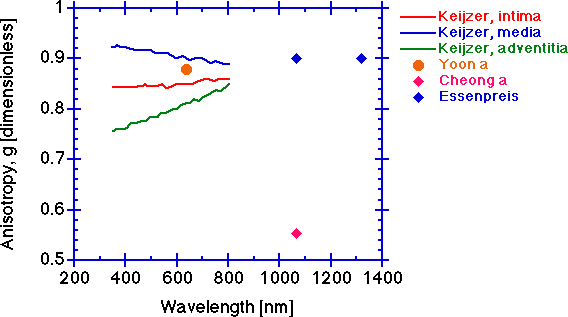
The scattering anisotropy g tends to be constant at longer wavelengths. The anisotropy will typically drop at shorter wavelengths. Again, the measurement depends on an accurate determination of μt and the caution cited above for determination of μs is also pertinent to determination of g. An erroneously low μt will cause deduction of an erroneously low μs which will cause an erroneously low g since the value of μs' is constant at its experimentally determined value. The simultaneously low values of Cheong a for μs and g, while the μs' value is comparable to others' values, are symptomatic of an erroneously low μt measurement.
The optical penetration depth, delta [cm]
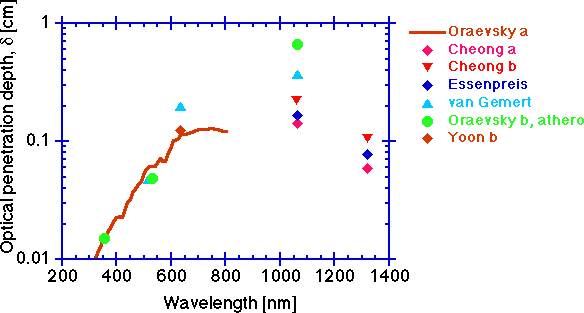
Finally, a parameter of practical importance is the optical penetration depth, delta [cm], which is the distance through tissue over which diffuse light decreases in fluence rate to 1/e or 37% of its initial value. In other words, the concentration of light in tissue falls exponentially with increasing distance, x (cm), from the source:
C(x) = (constant)exp(-x/delta)
where delta = 1/sqrt(3μa(μa + μs'))
Conclusions
In summary, the measurements of aorta optical properties are quite variable and offer only an approximate guide to the optical behavior of aorta or other vessels in vivo.