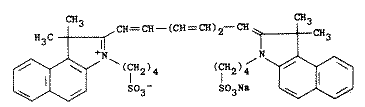
C43H47N2O6S2Na, Molecular weight 775. A tricarbocyanine type of dye with infrared absorbing properties; peak absorption at about 800nm. Has little or no absorption in the visible. It is used in infrared photography and in the preparation of Wratten filters. It is also used as a diagnostic aid for blood volume determination, cardiac output, or hepatic function. Merck Index
Uses of ICG
The classic paper on the spectral absorption properties of ICG is by Landsman who, in the introduction of his paper says,
After its introduction by Fox et al. (1957) indocyanine green soon came into general use for recording dye dilution curves, in particular for the determination of cardiac output. The principal advantages causing the rapid acceptance of the dye were the presence of an absorption maximum near the isobestic point of hemoglobin and oxyhemoglobin around lambda = 800nm, the confinement to the vascular compartment by binding to plasma proteins, the very low toxicity, and the rapid excretion, almost exclusively into the bile.
ICG has been used extensively in laser welding because of its absorption properties at the laser diode wavelength of 800nm. ICG has somewhat bizarre light absorption behavior as a function of concentration because it tends to aggegrate in water at high concentrations. This means that the effective absorption does not increase linearly with increasing concentration.
Furthermore, ICG tends to degrade with exposure to light. The photodegradation is mitigated when ICG is bound to albumin, but it still proceeds slowly (days). The photodegradation is also concentration dependent. For details see the Landsman paper.
When ICG is added to blood plasma, it is rapidly bound to proteins in the serum. This also changes its absorption spectrum. To summarize, ICG absorption depends on its concentration and its solute.
The Molar Extinction Coefficient Defined
If the transmission through a sample is given by T, then the absorbance A is
A = -log10 T
The ideal absorbance of a dilute solute in a transparent solvent follows the Beer's law
A = e c d
where e (liters/mole-cm) and is called the molar extinction coefficient of the solute at the wavelength of measurement, c (moles/liter) is the molarity of the solute, and d (cm) is the optical path length. The linear dependence of A on c may not hold if there are concentration-dependent effects, e.g., aggregation or acid-base dissociation of the solute. This certainly is the case for ICG.
If the absorption coefficient μa is desired then one uses the relations
T = exp(-μa d)
or that the absorption coefficient is directly proportional to the concentration and the molar extinction coefficient.
μa = e c ln 10 = 2.303 e c
To predict the absorbance of a particular solution of of ICG, if Beer's law was valid, then all that would be needed would be to multiply the molar extinction coefficient at your particular wavelength with the molar concentration and the path length. Unfortunately, ICG has different molar extinction coefficients for different concentrations. Furthermore, there are different molar extinction coefficients if proteins (e.g., albumin) is present. For a given concentration and wavelength, find the molar extinction coefficient from the graphs (you might have to interpolate) and use the above equations to convert to absorbance or absorption coefficient, depending on your application.
Landsman's ICG Data
Read Landsman's paper for the details on how these spectra were obtained. However, Landsman plotted his results using a somewhat screwy unit. I have digitized the data from Landsman and replotted it as wavelength versus molar extinction coefficient.
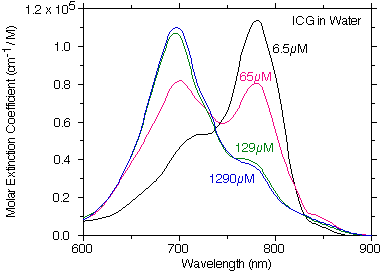
This is plot of the digitized Landsman ICG molar extinction coefficient of ICG in water showing how the absorption changes as the concentration of ICG changes. If ICG strictly followed Beer's law then each of the curves in this figure would be on top of one another.
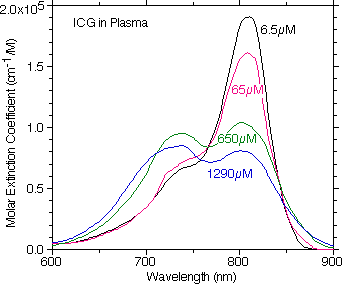
A plot of the digitized Landsman ICG molar extinction coefficient of ICG in plasma showing how the absorption changes at different concentrations in plasma. Note how the primary absorption peak is shifted to the red relative to the water absorption properties.
OMLC Measurements
If I was going to use anyone's data I would opt for the Landsman data because they must have been much more careful about their measurements. They also give data out to 900nm that whereas our HP spectrophotometer only goes to 810nm. However, these do show the absorption properties of ICG in the visible and are handy to have.
This data was taken using a cuvette consisting of two microscope slides with a cover slip as a 155μm spacer. This allowed measurements that did not exceed an absorbance of 2 and thus ensured that the HP Spectophotometer remained in its linear range of operation.
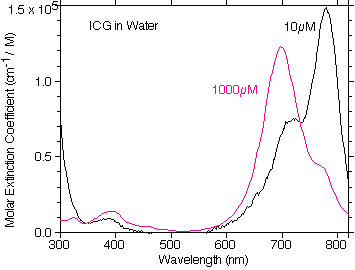
A plot of the OMLC measured molar extinction coefficient of ICG in water at 0.01mM and 1mM concentrations. There is very little absorption in the visible and the general trend of the absorption as a function of concentration follows that of Landsman.
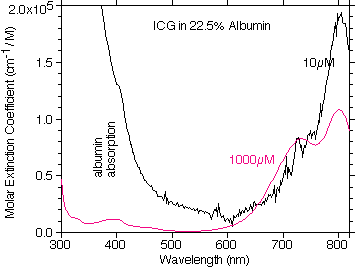
A plot of the OMLC measured molar extinction coefficient of ICG in 22.5% albumin at 0.01mM and 1mM ICG concentrations. The similarity to plasma is evident. The noise in the data at the low concentration is a result of the strong absorption by albumin in the 300-350nm range.