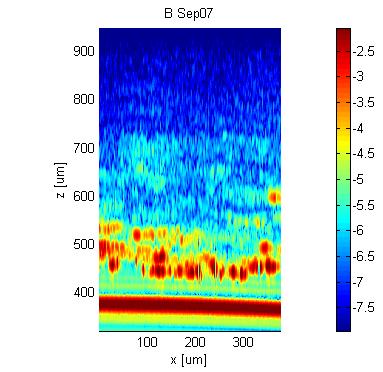
 "Bad" bandage.
Note the continous strongly reflective layer near the surface (at z ≈ 450-500 μm), which indicates a horizontal lamina that seals the surface and prevents the bandage from absorbing blood and adhering to the wound.
The images of a "good" and "bad" bandage are shown below. These are reliably representative of the appearance of several such bandages tested. The data is shown as the reflectivity of intensity (I) on a log scale, indicated by the colorbar, where reflectivity from a mirror defines unity (1 = 100):
signal = log10(I)
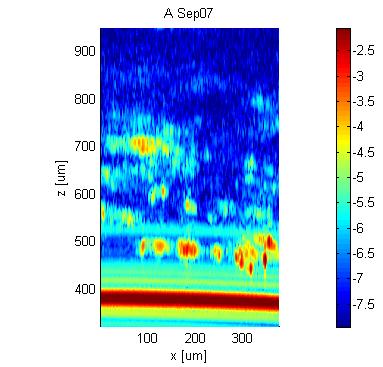 "Good" bandage.
"Bad" bandage.
Note the continous strongly reflective layer near the surface (at z ≈ 450-500 μm), which indicates a horizontal lamina that seals the surface and prevents the bandage from absorbing blood and adhering to the wound.